
Valentine Math(ness)
 Bart Buckinx —
With Valentine's Day coming up, our BookWidgets team is in a romantic mood. Combined with us being engineers this can give surprising results:
 Click to open
|
 Click to open
|
 Click to open
|
- Move the slider to see our heart bounce
- There’s more than one way to draw a heart
- And we love to give you a flower for Valentine’s Day
With these examples created, it looked like a good opportunity to dig a little bit more into how our Active Plot widget works. Read until the end and we will unveil the magic behind the heart and the daisy widget.
How the Active Plot widget works
With the Active Plot widget, you can define an interactive math plot, for example a formula like "y = a*sin(b*x)". Students can play around with the parameters a and b and immediately see the effect on the plot, thereby developing an intuition for how the formula "works".
Defining the function
There are 3 kinds of functions that can be defined:
- In the cartesian plane as y=f(x)
(http://en.wikipedia.org/wiki/Graph_of_a_function) - As a polar equation r=f(t)
The function will be plotted in x, y but is defined as polar coordinates (r and t).
(http://en.wikipedia.org/wiki/Polar_coordinate_system) - As a parametric curve f(t);g(t)
(http://en.wikipedia.org/wiki/Parametric_equation)
Adding Parameters to it
You can add parameters to your equation. This is to help students have a better understanding of how the equation “works”. For each parameter, a default value, a minimum value and a maximum value must be defined.
And now our examples
The Heart curve: here is a good write-up of the math behind the heart curve:
http://mathworld.wolfram.com/HeartCurve.html
We’ve made 2 examples, the first defined as polar coordinates:
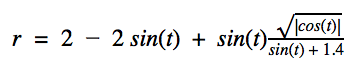
In the Active Plot widget editor, you need to enter this as:
r=(2-2*sin(t)+a*(sin(t)*(sqrt(abs(cos(t)))/(sin(t)+1.4))))
a is the parameter, default is 1 and it ranges from 0.5 to 2
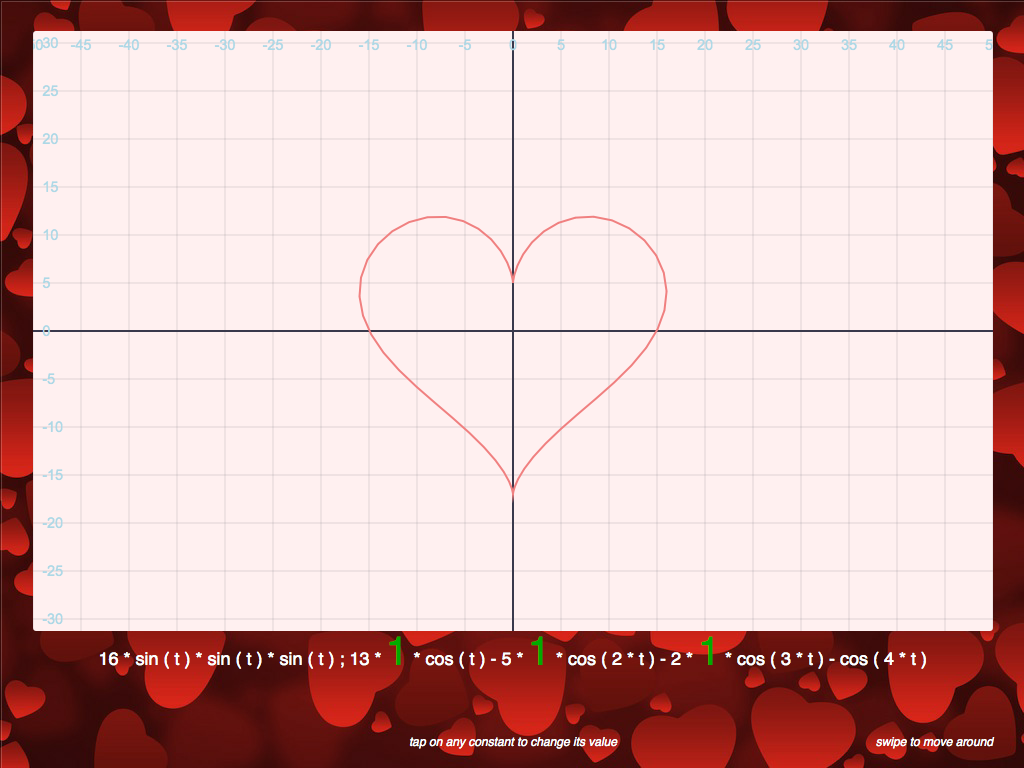
The second example is a parametric curve:
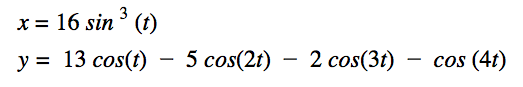
In the Active Plot editor, enter this as:
16*(sin(t))^3;13*a*cos(t)-5*b*cos(2*t)-2*c*cos(3*t)-cos(4*t)
where a,b and c are parameters to play with and shape your heart.
Range for a is from 0.5 to 2. b from 0 to 3 and c from 1 to 2. Each parameter changes a specific aspect of the shape of your heart.
More info on which mathematical symbols can be used in Active Plot widgets, is available in the tool by clicking ‘Learn more here’.
Daisy
Here is some background on the math involved in drawing the rose:
http://mathworld.wolfram.com/Rose.html
We can adjust the formula a bit and add some parameters.
r=sin(a*t)+b
a range from your minimum number of leaves to your maximum number of leaves, this example uses 5 to 10. b defines the size if the eye of your daisy.
Here is the example
Do you know any spectacular or beautiful looking curves you want to share?
Let us know, we love to hear from you.

